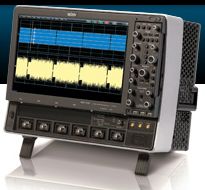
3.5 GHz, 20 GS/s, 4ch, 20 Mpts/Ch SDA with 15.4" WXGA Color Display
Powerful SDA II Analysis Package
Unleash the power of serial data analysis to understand and characterize your design, prove compliance, and determine why a device or host fails compliance.
But how do you determine why a device fails compliance? LeCroy's SDA II serial data debug software is the most powerful and versatile solution for finding the root cause of serial data compliance failures. SDA II provides the confidence you need to ensure proper functionality.
While some solutions simply provide problem notifications, the SDA 7 Zi is the only oscilloscope that helps you identify the problem and and put your project back on schedule.
Versatile SDA II for Compliance and Debug
For compliance testing, LeCroy's QualiPHY compliance test suite provides the best available solutions to automate, configure and document standardized tests. However, when a design fails a compliance test, the engineer needs an advanced set of tools to identify and solve those problems. The LeCroy SDA 7 Zi includes a debugging toolset that provides insight into eye and jitter analysis. Armed with this insight, engineers can confidently drill down and identify the root cause. The Quick View of the SDA shows the Eye Diagram, TIE Track, Bathtub Curve, Jitter histogram, NQ-Scale and Jitter Spectrum. No other analyzer provides simultaneous interaction and real-time changes in all six measurements. LeCroy's X-Stream II Architecture provides fast updates and the fastest eye interpretation. The fastest eye building and the maximum unit intervals per second means the shortest time to reach a solution.
A high-speed serial trigger enables triggering on up to 2.7 GB/s serial patterns of up to 80-bits in length, allowing up to two 8b/10b primitives to be triggered on. Jitter calculations are based on statistics. With the most advanced long memory performance to 256 Mpts/Ch and X-Stream II enabled responsiveness, eye and jitter analysis occurs rapidly.
Automated Compliance Testing
QualiPHY compliance test suite provides easy to use step-by-step instructions for testing compliance on a wide array of serial data standards. Fast automated test operation, illustrated instructions, and connection diagrams simplify the process. Complete test reporting is provided along with a 'stop on fail' feature which begins the debug process.
Whether debugging eye pattern or other compliance test failures, the SDA 7 Zi Series has the accessible tools. Rapidly isolate the source of the problem in your design. Advanced usability like 8b/10b decode, mask violation locator, ISI plot, and equalization are easy to find. Provide cable characteristics and Cable De-embedding automatically adjusts for the cable effects. The result—true rise time and amplitudes in measurements. The SDA uses the same flexible math on math analysis which is valuable when understanding design behavior in the event of a compliance failure.
SDA II – Advanced Tools to Isolate and Analyze
Flow Diagram User Interface
Eye and Jitter Analysis in the SDA 7 Zi begins with a simple, interactive flow diagram user interface intuitively guiding the user through the setup of Eye Measurements, Jitter Measurements, or both at the same time.
Serial Trigger
The SDA 7 Zi Series comes standard with the 80-bit Pattern Trigger installed. The SDA 760Zi and SDA 740Zi include the High-speed Pattern Trigger option (up to 2.7 Gb/s), while the SDA 735Zi and SDA 725Zi pattern triggers up to 1.25 Gb/s. Both pattern triggers provide a recovered clock and data output on the front of the oscilloscope.
8b/10b Decoding
LeCroy's 8b/10b serial decode option with powerful search capability enables captured waveforms to be searched for user-defined sequences of symbols. Multi-lane analysis decodes up to four simultaneously captured lanes.
Equalization
Equalization removes the effects created in systems that utilize equalization. Users can view the eye of a waveform as seen by a receiver that employs equalization.
ISI Plot
The ISI plot displays data dependent jitter contributions to the eye pattern for the second-to-last bit of a bit length, set from 3 to 10. This plot measures data dependent jitter without the need for a repeating bit pattern.
Jitter Spectrum
- The jitter spectrum plot allows viewing of any periodic jitter
- Peak annotation displays the frequencies directly on the spectrum
- The LeCroy spectrum plot allows viewing of DDj removal for maximum understanding
Jitter Trend
- Time domain view of jitter shows transient jitter events often missed by viewing can be missed by viewing the histogram alone
- The jitter trend clearly shows any non-stationary jitter behavior
Histogram & Bathtub
- Display of measured jitter histogram clearly shows any unusual jitter distributions such as bi-modal or non-Gaussian tails. By simply viewing the jitter breakdown (Rj, Dj), the raw data view shows jitter behavior that can be lost
- This unprocessed display gives a high degree of confidence in the accuracy of the jitter breakdown and bathtub curve
Eye Patterns Show Mask Violations to the Bit
- Eye pattern measurement on up to 8 million consecutive bits ensures that even transient jitter and noise events are captured
- Consecutive bit eye pattern analysis allows for the measurement of the wave shapes of individual bits that violate the compliance mask (violation location)
- The fastest UI accumulation and very low measurement jitter (typically 1 ps rms)
Cable De-embedding
Even expensive, high-performance cabling can have an adverse effect on measurements and steal margin from a design. Cable losses and slow rise times can lead to intersymbol interference that is induced by the measurement system but is not present in the design. The cable de-embedding feature removes these adverse effects leading to more accurate measurements.
Superior Eye Diagram Analysis
SDA II Advanced Debug for Eye and Jitter Analysis
LeCroy's X-Stream II technology enables unprecedented speed in eye diagram creation. With a 15.3" high definition display and flexible landscape views, the SDA 7 Zi provides more insight into eyes than ever before. New features, such as IsoBER, add insight to the traditionally non-quantitative view of eye openings.
In addition, properly distinguishing between the random and deterministic jitter in a serial data signal is a crucial part of being able to reduce the overall jitter. For example, properly identifying frequencies at which periodic jitter is present is typically a common part of determining that jitter source. The SDA 7 Zi is the only analyzer that fully integrates jitter measurements into the oscilloscope software leading to greater confidence in jitter measurements.
Dual-Eye View Mode
Viewing the Transition and Non-Transition eye diagrams allows for analysis of de-emphasis in serial data waveforms. In addition, Dual-Eye Gated enables the creation of two separate eyes based on a separate signal input (i.e. Read/Write).
Mask Violation Locator
Mask failures are identified by contrasting color spots which appear anywhere the data intersects the mask template. Users can call up the actual stored bit stream waveform at the point in time of the initial failure. The actual bit sequence is also identified, pointing out any ISI problems. Instantly jump to the next violation, or any other within the stored pattern.
IsoBER
Mask testing is not always the best way to determine if the signal is going to meet Bit Error Rate requirements because it lacks quantitative analysis of vertical noise and jitter. LeCroy's unique IsoBER analysis tool provides this quantitative analysis by extrapolating the eye diagram data and displaying the lines of BER directly on the eye. This helps to quickly determine the minimum eye opening and also is instrumental in detecting cross-talk by analyzing the vertical eye closure. These measurements are not possible with standard eye diagram techniques.
More confidence in jitter Breakdown
Simplify Jitter Decomposition
The sources of jitter can be categorized as Deterministic or Random, which is an important distinction in calculating the Total Jitter (TJ) of a signal. There are cases where cross talk, or other types of deterministic jitter, can masquerade as random jitter and cause incorrect calculations.
LeCroy's integrated SDA II jitter analysis offers two decomposition algorithms to account for these situations, giving the user confidence that all jitter components are accurately recognized and processed correctly. The jitter decomposition calculates both methods simultaneously and alerts the user only when there is a deviation between the results, giving assurance that the correct jitter values are displayed.
Intuitive Jitter Breakdown Displays
LeCroy's SDA II Serial Data Analysis provides intuitive graphical views of jitter decomposition to quicken insight to the root cause.
To understand deterministic jitter values and their sources, SDA II provides the following tools:
- Periodic Jitter Spectrum identifies the sources contributing the highest values of Pj.
- ISI Plot isolates bit patterns that contribute the most Intersymbol Interference (ISI)
- DDJ Histogram provides a greater understanding of the distributionof Data Dependent Jitter (DDJ)
Setup Warning Indicators
Green / Yellow / Red setup warning indicators alert the user if there is something that requires their attention. For example, if the user's input signal is a clock and they have not selected clock as their signal type, a yellow indicator will be displayed informing the user that they have an inconsistency in the setup that may require their attention.
- 制造商: Teledyne LeCroy
- 模型: SDA 735Zi


;)